Understand the Key Manufacturing Metrics and the Ones That Are Right for Your Business.

Key Manufacturing Metrics
Table of contents
loading...
Defining Key Manufacturing Metrics
Manufacturing metrics help factories measure production efficiency, machine performance, downtime, quality, and overall operational effectiveness.
Manufacturers use metrics such as OEE, machine utilisation, cycle time, downtime, and first pass yield to identify bottlenecks, improve productivity, reduce waste, and increase factory capacity.
The right manufacturing KPIs depend on your production environment, whether you run CNC machining, batch manufacturing, discrete manufacturing, high-volume production, or mixed-model operations.
Key Manufacturing Metrics:
Manufacturers rely on key performance indicators (KPIs) to measure production efficiency, machine performance, downtime, quality, and overall operational effectiveness. Tracking the right manufacturing metrics helps factories identify bottlenecks, improve productivity, reduce waste, and increase available production capacity.
The most valuable manufacturing KPIs vary by industry, production environment, and operational goals. CNC machining companies, discrete manufacturers, fabrication businesses, and high-volume production facilities all face different operational challenges and require different performance measurements.
By selecting and monitoring the right manufacturing metrics, including OEE, machine utilisation, downtime, cycle time, throughput, and first pass yield, manufacturers can make data-driven decisions that improve factory performance, increase profitability, and support continuous improvement initiatives.
There are five key manufacturing metrics that we come across often with our clients. These are:
- Overall Equipment Effectiveness (OEE)
- Downtime
- Utilisation
- Total Effective Equipment Performance (TEEP)
- First Pass Yield (FPY)
Let’s look at each of these in more detail.
Overall Equipment Effectiveness
Overall Equipment Effectiveness (OEE) is a manufacturing KPI used to measure how effectively production equipment is operating. Manufacturers use OEE to track machine productivity, identify production losses, reduce downtime, and improve operational performance across production lines and factory environments.
OEE is most commonly used in high-volume and production-line manufacturing, where maximising machine uptime, throughput, and product quality is critical to maintaining efficiency and profitability. An OEE report gives factory managers and operations teams real-time insight into equipment performance, helping them identify bottlenecks, improve productivity, and increase manufacturing capacity.
OEE measures manufacturing effectiveness using three key components:
- Availability, which measures downtime and machine uptime
- Performance, which measures how efficiently equipment operates compared to its maximum potential
- Quality, which measures the percentage of good-quality products produced
By analysing Availability, Performance, and Quality together, manufacturers can better understand how effectively equipment is utilised, where production losses occur, and which operational improvements will have the greatest impact on factory performance and productivity.
By identifying inefficiencies in machine utilisation, equipment performance, and production processes, manufacturers can reduce downtime, improve OEE, increase throughput, and increase overall manufacturing efficiency.
Learn more about what OEE is and how to improve OEE in our helpful guides. You can also monitor your OEE in real-time with our OEE machine monitoring software.
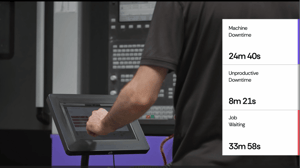
Machine Downtime
Machine downtime refers to periods when a machine or piece of manufacturing equipment is unavailable for production. Manufacturers typically classify downtime into two categories: planned downtime and unplanned downtime.
Planned downtime includes scheduled maintenance, tool changes, inspections, and setup activities that are necessary to support production operations. Unplanned downtime includes unexpected machine failures, breakdowns, material shortages, operator issues, and other disruptions that stop production unexpectedly.
Downtime tracking is an important manufacturing KPI for all production environments, including batch manufacturing, discrete manufacturing, process manufacturing, and high-volume production facilities.
Reducing unplanned downtime helps manufacturers minimise production delays, improve machine utilisation, increase output, reduce operational costs, and improve overall factory productivity and OEE.elays, increase output, and reduce costs.
By analysing downtime data, manufacturers can identify the root causes of machine breakdowns, production stoppages, and operational inefficiencies. This helps operations and maintenance teams implement preventive maintenance strategies, reduce recurring downtime, improve machine reliability, and increase overall manufacturing efficiency and profitability.
Learn why understanding machine downtime is so important, and see how FourJaw’s machine downtime monitoring software can help boost productivity and reduce costs.
Machine Utilisation
Machine utilisation measures the percentage of planned production time during which manufacturing equipment is actively operating. Manufacturers use machine utilisation metrics to understand how effectively machines, production lines, and factory assets are being used during scheduled operating hours.
Tracking machine utilisation helps manufacturers identify underused equipment, production bottlenecks, idle machine time, and hidden factory capacity. By improving utilisation, manufacturers can increase production output, optimise capacity planning, reduce lead times, and improve overall manufacturing efficiency without investing in additional machinery.
Machine utilisation is an important manufacturing KPI across a wide range of production environments, including batch manufacturing, discrete manufacturing, process manufacturing, and high-volume production facilities.
Low machine utilisation rates can indicate production bottlenecks, idle equipment, scheduling inefficiencies, or underused manufacturing capacity. By monitoring and improving machine utilisation, manufacturers can increase production output, maximise existing factory capacity, reduce lead times, and improve overall operational productivity and efficiency.
Total Effective Equipment Performance (TEEP)
Often used in large-volume manufacturing, TEEP combines OEE and utilisation metrics to provide a comprehensive assessment of equipment performance. It measures the overall efficiency of equipment by considering both planned and unplanned downtime
TEEP helps manufacturers identify losses caused by factors such as equipment breakdowns, changeovers, and other non-productive events. By analysing TEEP data, manufacturers can make informed decisions to improve equipment efficiency and reduce operational costs.
First Pass Yield (FPY)
First Pass Yield (FPY) is also known as Throughput Yield (TPY) and is the percentage of products that pass quality inspection on the first attempt (right first time). FPY/TPY is a metric used often in large volume, production line manufacturing.
High FPY indicates that the manufacturing process is consistently producing products of the desired quality. By monitoring FPY, manufacturers can identify areas for improvement in their processes, reduce waste, and enhance customer satisfaction with defect-free products.
While these five metrics are common in manufacturing, they by no means constitute an exhaustive list. Below, we’ve included some more manufacturing metrics that may be more relevant to your manufacturing operations.
A Guide to Improve OEE
Read our latest article to learn about the benefits and drawbacks when using OEE as a measure of manufacturing productivity.Productivity Metrics
Capacity Utilisation
Refers to how much of a plant's total capacity is in use.
The rate of capacity utilisation equals the ratio of the actual output over the maximum potential output multiplied by a hundred per cent.
Cycle Time
Cycle time measures the time it takes to complete a single production cycle. It's a critical metric for understanding production efficiency and identifying bottlenecks that might be causing delays. Cycle time refers to the average time between the completion of units; to calculate it, divide the number of units by the time taken to complete them. For example, If 80 units are completed in a 40-hour week, the cycle time is 2 hours on average.
On-Time Delivery
The percentage of products delivered on time compared with the total quantity of products delivered. To calculate on-time delivery, divide your total number of on-time deliveries by your total number of deliveries, then multiply your result by 100 to get a percentage.
Recovered Hours
A metric used to measure the performance of an asset over a time period. It is calculated by multiplying the cycle time by the number of units produced. However, it is often open to error due to incorrect base data on cycle time or because setups/productive downtimes are not accounted for as part of the measure.
Customer Order Fill Rate
This metric indicates the percentage of customer orders that are filled on time and in full. It reflects the company's ability to meet customer demand accurately. Fill rate is the ratio of the number of orders fulfilled over the total number of orders received multiplied by the percentage.
Downtime
Downtime measures the amount of time that equipment or processes are not operational. Reducing machine downtime is crucial for maximising productivity.
Learn more about why understanding machine downtime is essential for manufacturers.
Production Volume
Measures how many units are made in a given timeframe. To calculate production volume, divide the standard direct labour hours of actual production by the budgeted direct labour hours, then multiply the answer by 100 to get a percentage.
TEEP
Combines OEE and utilisation metrics to provide a comprehensive assessment of equipment performance. The formula for calculating TEEP is: Performance x Quality x Availability (where Availability = Actual Production Time / All Time).
Quality Metrics
FTY
First Time Yield describes the ratio of the number of non-defective products released to the total number of units manufactured. To calculate FTY, divide the number of products that pass through a step of the process without error on the first attempt by the total number of products being tested.
MTBF
Mean Time Between Failures measures the reliability of equipment and how long it can operate before experiencing a failure. To calculate MTBF, divide the total uptime by the number of breakdowns that occurred over the same period.
Yield
Yield measures the percentage of products that meet quality standards out of the total produced. Tracking yield helps identify defects, quality issues, and potential areas for process improvement. To calculate the yield rate, simply divide the number of acceptable units by the total number of units entering production.
FPY
First Pass Yield (sometimes referred to as Throughput Yield (TPY)) is the percentage of products that pass quality inspection on the first attempt (right first time). It highlights the effectiveness of the production process and reduces the need for rework or additional processing. To calculate first pass yield, divide the acceptable parts by the total number of parts produced during manufacturing. The higher the calculation, the better your product overall. The formula for FPY is: FPY = Quality Units / Total Units Produced.
Scrap and Rework Rates
These metrics quantify the amount of materials discarded due to defects or the need for rework. Reducing scrap and rework rates improves resource utilisation, provides a higher margin, enables better capacity planning and lowers costs to free up working capital.
Customer Reject Rate
A measure of how many parts delivered to customers are defective, customer reject rate gives a good insight into the quality of your operations. To calculate reject rate, divide the number of rejected products by the total output.
Financial Metrics
Maintenance costs
All expenses required to maintain and repair equipment. When calculating total maintenance costs, you’ll need to take into account all components that are part of daily maintenance work, including labour costs, material parts price, and other invoices.
ROA
Return on Assets works out a manufacturer's profitability in relation to its available assets, dividing net income by the average value of total assets. To calculate ROA, divide a firm’s net income by the average of its total assets, then multiply it by 100 to get a percentage.
ROR
Rate of return is a percentage that accounts for the profit and loss resulting from an investment over time. To calculate the rate of return for an investment, subtract the value of the investment from its final value; then, divide this amount by the starting value of the investment, and multiply this figure by 100 to get a percentage.
Unit Costs
The average cost to manufacture one unit, taking into account both variable and fixed costs. To calculate unit costs. Combine your variable and fixed costs and divide this figure by the number of units produced.
Scrap Material Value
The amount manufacturers earn from their scrap material minus disposal costs. Selling scrap material is a good way for manufacturers to get a bit of extra money. Scrap material prices will vary depending on quality and the state of the current market; once you’ve determined a price, simply subtract your disposal costs to reveal scrap material value.
Inventory Turnover
Inventory turnover measures how many times inventory is used and replenished within a specific period. High turnover rates indicate efficient inventory management and reduced carrying costs. To calculate inventory turnover, divide the cost of goods sold by your average inventory value.
Implementing Manufacturing Metrics Successfully
Effective implementation of manufacturing metrics requires a data-driven culture within the organisation. Encouraging employees to embrace technologies that enable accurate, real-time data collection to inform decisions based on insights fosters a proactive approach to problem-solving and continuous improvement. By investing in smart technologies such as machine monitoring, manufacturers can effectively capture key production data and use it to make short, medium and long-term operational and commercial decisions.
To continuously improve performance, manufacturers must regularly review their KPIs to ensure they are the right metrics to be measuring based on the overall business goals. By remaining relevant and aligned with ever-changing business goals and market dynamics, manufacturers can unlock their full potential for growth, efficiency, and competitive advantage.
Best Practices
Set Achievable and Realistic Targets
Ensure the metrics you choose align with the organisation's overall KP’s/goals. Targets should be realistic and attainable, motivating teams to strive for continuous improvement without feeling overwhelmed by unattainable expectations.
Understanding benchmarks based on historical internal data and external industry data helps in evaluating performance accurately and identifying areas that need improvement.
Regularly Monitor and Analyse Data
Manufacturers should establish a regular data collection and analysis schedule, ensuring that insights are acted upon promptly.
Real-time monitoring using tools such as manufacturing analytics software enables manufacturers to make timely decisions and respond swiftly to emerging issues. Additionally, historical data analysis helps identify trends, patterns, and recurring challenges, allowing businesses to adopt preventive measures and make data-driven decisions that improve a process.
Invest in Employee Training
Training programs should focus on enhancing employees' data analysis and problem-solving skills, ensuring that they can interpret metric insights accurately and apply them effectively. A well-trained workforce is better equipped to identify the root causes of issues, collaborate on improvement initiatives, and contribute to achieving organisational goals.
Adapt Your Measures to Changing Market and Business Needs
If we can be certain of anything in the world of manufacturing, it’s safe to say it doesn’t stand still. As market dynamics change and new challenges arise, manufacturers should review and update their selected metrics to remain aligned with overarching business KPIs and goals. Flexibility in metric selection allows manufacturers to respond effectively to emerging trends and challenges, ensuring that you continue to provide relevant and valuable insights.
Involve Relevant Stakeholders
Engage employees at all levels, from the factory floor to top management. Involvement creates a sense of ownership and fosters a culture where employees understand the importance of the metrics being measured and how they contribute to the organisation’s overall KPIs.
An efficient way to make sure all stakeholders are aware of the key metrics being measured is by visualising the data on the factory floor using screens.
Implement Continuous Improvement Initiatives
By default, measuring key metrics in your manufacturing operations gives you the opportunity to continually improve based on the data being measured. By measuring, understanding and benchmarking your data enables you to remove inefficiencies that otherwise may have gone unnoticed. Implementing Kaizen methodologies will enable stakeholders at all levels to have a continuous improvement mindset.
Read our guide ‘How to implement a continuous improvement strategy’ in your factory.
Promote Knowledge Sharing
As we touched on earlier, getting staff at all levels to understand what and why you measure what you do within your processes ensures individuals, teams and the whole organisation can work to the best of their ability to achieve the overarching business goals.
Factory or team leaders should encourage a culture of internal knowledge sharing amongst their peers. For example, comparing machine utilisation data by shift or site is a great way to understand what has or is working well. Teams or individuals can then transfer that knowledge and apply it to processes that may not be working as well in their shift or site.
Manufacturing Metrics
Real-Life Examples by Sub-Sector
Aerospace and Defence Manufacturing
In the aerospace and defence industry, it is common for manufacturers to closely monitor the Mean Time Between Failures (MTBF) metric, which measures the reliability of equipment and how long it can operate before experiencing a failure. Additionally, the First Pass Yield (FPY) metric is essential in ensuring that the manufacturing process produces products meeting the required quality standards without the need for rework or repair during the first production attempt.
By tracking these metrics, aerospace and defence manufacturers can optimise equipment performance, reduce downtime, and maintain the highest standards of product quality. Using metrics such as these play a crucial role for aerospace and defence manufacturers in maintaining precision, safety, and adherence to strict regulatory standards.
Optimise your aviation and aerospace manufacturing processes with FourJaw.
Automotive Manufacturing
Manufacturing metrics are essential for maintaining high-quality production and operational efficiency in the automotive industry. One of the key metrics used is Overall Equipment Effectiveness (OEE), which assesses equipment effectiveness based on factors such as availability, performance, and quality.
Utilisation is another important metric, measuring the percentage of time that equipment is in use during planned production hours.
By closely monitoring OEE or utilisation, automotive manufacturers can identify bottlenecks, optimise production schedules, and streamline their manufacturing processes. This leads to increased overall equipment efficiency, improved production output, and reduced lead times, resulting in enhanced competitiveness.
Learn how automotive manufacturers can use FourJaw to improve their operational efficiency with our machine monitoring platform.
Food and Beverage Manufacturing
The food and beverage industry relies on manufacturing metrics to ensure food safety, maintain product quality, and enhance production efficiency.
A common metric used is Throughput, which measures the rate at which goods are produced, ensuring that production meets customer demand. Another valuable metric is Yield, which calculates the percentage of usable output from raw materials, thereby reducing waste in the production process.
By closely monitoring these metrics, food and beverage manufacturers optimise production rates, minimise wastage, and improve overall operational efficiency, leading to better customer satisfaction and increased profitability.
Improve the efficiency of your processes with manufacturing analytics for food and beverage production.
Subcontract Manufacturing
Subcontract manufacturers typically have tight production schedules. Therefore, utilisation and downtime are two of the most common metrics used in this manufacturing sub-sector. Optimising production capacity is essential for contract manufacturers: measuring utilisation allows them to reduce bottlenecks and lead times while measuring downtime is crucial for maximising productivity.
On-time delivery, which measures the percentage of orders delivered to customers on time is another commonly used metric by subcontractors. By closely monitoring utilisation, downtime, and On-Time Delivery, subcontract manufacturers can optimise equipment utilisation, ensure timely deliveries, and enhance customer satisfaction. This leads to increased business opportunities, positive customer relationships, and improved competitiveness in the subcontract manufacturing industry.
Sterling Machining is a precision machining company that specialises in the extrusion tooling and subcontract machining industries. It was founded in 2001 by three directors, who between them have more than 90 years of combined experience in the manufacturing and metal extrusion industry. With the aid of FourJaw's data-driven insights, Sterling Machining fine-tuned its operations, achieving remarkable revenue growth from £3.8 million to £5 million. These insights were pivotal in realising a 25% uplift in their machine utilisation rates. Learn more about the Sterling Machining success story.
Pharmaceutical Manufacturing
Pharmaceutical manufacturing demands stringent quality control and compliance with regulations. Manufacturers in this industry utilise the Overall Equipment Effectiveness (OEE) metric to assess equipment efficiency and identify areas of improvement in production processes.
In addition, the First Time Right (FTR) metric is crucial, measuring the percentage of products passing quality control without the need for rework. By closely monitoring OEE and FTR, pharmaceutical manufacturers can optimise equipment performance, reduce downtime, and maintain the highest standards of product quality and safety and regulatory compliance.
Learn more about manufacturing analytics for medical device manufacturers.
Textile Manufacturing
Textile manufacturing relies on optimising production processes and minimising waste. Manufacturers track the Inventory Turnover Ratio, which measures the number of times inventory is sold and replaced within a specific period.
Additionally, the Throughput metric is crucial in measuring the rate at which textiles are produced, ensuring that production meets customer demand.
By monitoring these metrics, textile manufacturers can manage inventory efficiently, reduce material waste, improve overall production efficiency and maximise inventory margins.
Manufacturing Metrics: A Summary
To summarise, having the right manufacturing metrics help you to understand what you are doing well and not so well, enabling you to make informed decisions to improve processes where appropriate.
It is important to make sure your strategic organisational goals and KPIs are defined first, to ensure the right metrics are in place to help you measure and track the progress towards achieving those goals.
However, no matter what you manufacture, from our experience, the single most important manufacturing metric is to start by understanding how productive your machines are.
By understanding this metric, manufacturers can inform production and process improvements across their manufacturing operations.
Ready to
Learn More?
See how FourJaw's plug-and-play analytics can help you turn machine data into real productivity gains. What would you like to do next?