OEE Monitoring Software
Monitor Overall Equipment Effectiveness in real-time.
Measure OEE without the Hassle
Measure what matters.
FourJaw calculates OEE Availability and Quality metrics in real time, helping you benchmark, track improvement, and maximise machine utilisation.
Get an OEE Availability score by machine, cell, production line or factory, in real-time and over time.
Understand the underlying reasons for any production losses and take corrective action.
Use accurate Availability and Quality OEE data to inform process and behavioural changes to drive improvement.
OEE
Features
OEE Availability Trends
Know what 'good' OEE looks like in your factory
-
See your overall Availability OEE trend by hour, day or shift.
-
Zoom out or in - see your OEE trend by factory, cell, production line or machine.
.png?width=300&name=OEE%20Availkability%20(Medium).png)
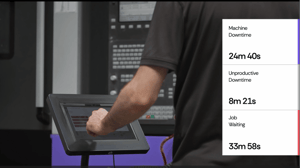
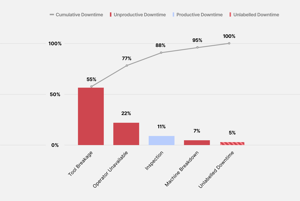
See Your top downtime reasons
-
Not all downtime is equal. Track time in each state, productive or unproductive.
-
Use Downtime Pareto to reveal the top causes, so you know exactly where to focus to improve Availability and operational performance.

OEE Quality Reports
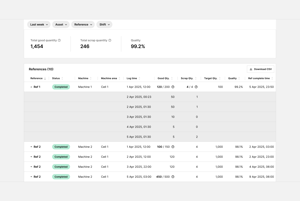
See Overall Equipment Effectiveness by shift.
-
Quality measures the percentage of parts your machines produce that meet standards, directly contributing to your OEE score, with 100% meaning every part made is good.
-
The Production Quantity report shows total good parts, scrap, and Quality % by job reference, machine, and machine area, so you can clearly see how quality performance impacts OEE and where losses occur.

Customers see an Av. increase of +20% in manufacturing productivity
According to Make UK, 74% Of Manufacturers Cite Improving Productivity As A Key Driver For Investment.FAQ
Didn’t find what you were looking for? Send us a message via the contact form and we’ll make sure it gets to the right person.
The OEE measure in manufacturing looks at three factors: Quality, Performance and Availability.
FourJaw's machine monitoring platform is designed to measure and track Availability and log and report on Quality.
OEE in FourJaw tracks the availability of your machine using the downtime reasons logged by machine operators.
Examples of Availability Downtime reasons include: Machine fault, Tool broken, Set Up, Unplanned maintenance, etc.
The Production Quantity report displays total good parts, scrap, and Quality %, broken down by job reference, machine, and machine area so you can quickly see where quality losses occur.
FourJaw’s OEE software reports on two key metrics: Availability and Quality.
Availability
The availability measure monitors a machine, cell, or factory's actual runtime versus planned runtime. This data can be used to highlight how much-unplanned downtime and quality issues are impacting your factory's productivity.
A score of 100% means your machine ran continuously throughout its planned production time — no stops at all.
Quality
Quality measures the proportion of the parts your machines produce that are good, not scrapped or reworked. A score of 100% means every part produced was a good part.
The Production Quantity report shows total good quantity, scrap quantity, and quality percentage, broken down by job reference, machine, and machine area. The report shows you:
-
Total good quantity — the number of parts that passed quality checks
-
Total scrap quantity — the number of parts that were rejected
-
Quality % — your Quality component for OEE, calculated automatically
A breakdown by job, Reference, Machine, and Machine area — so you can see exactly where quality losses are occurring
Ready to
Learn More?
See how FourJaw's production monitoring can help you turn machine data into real productivity gains that improve your OEE score.

